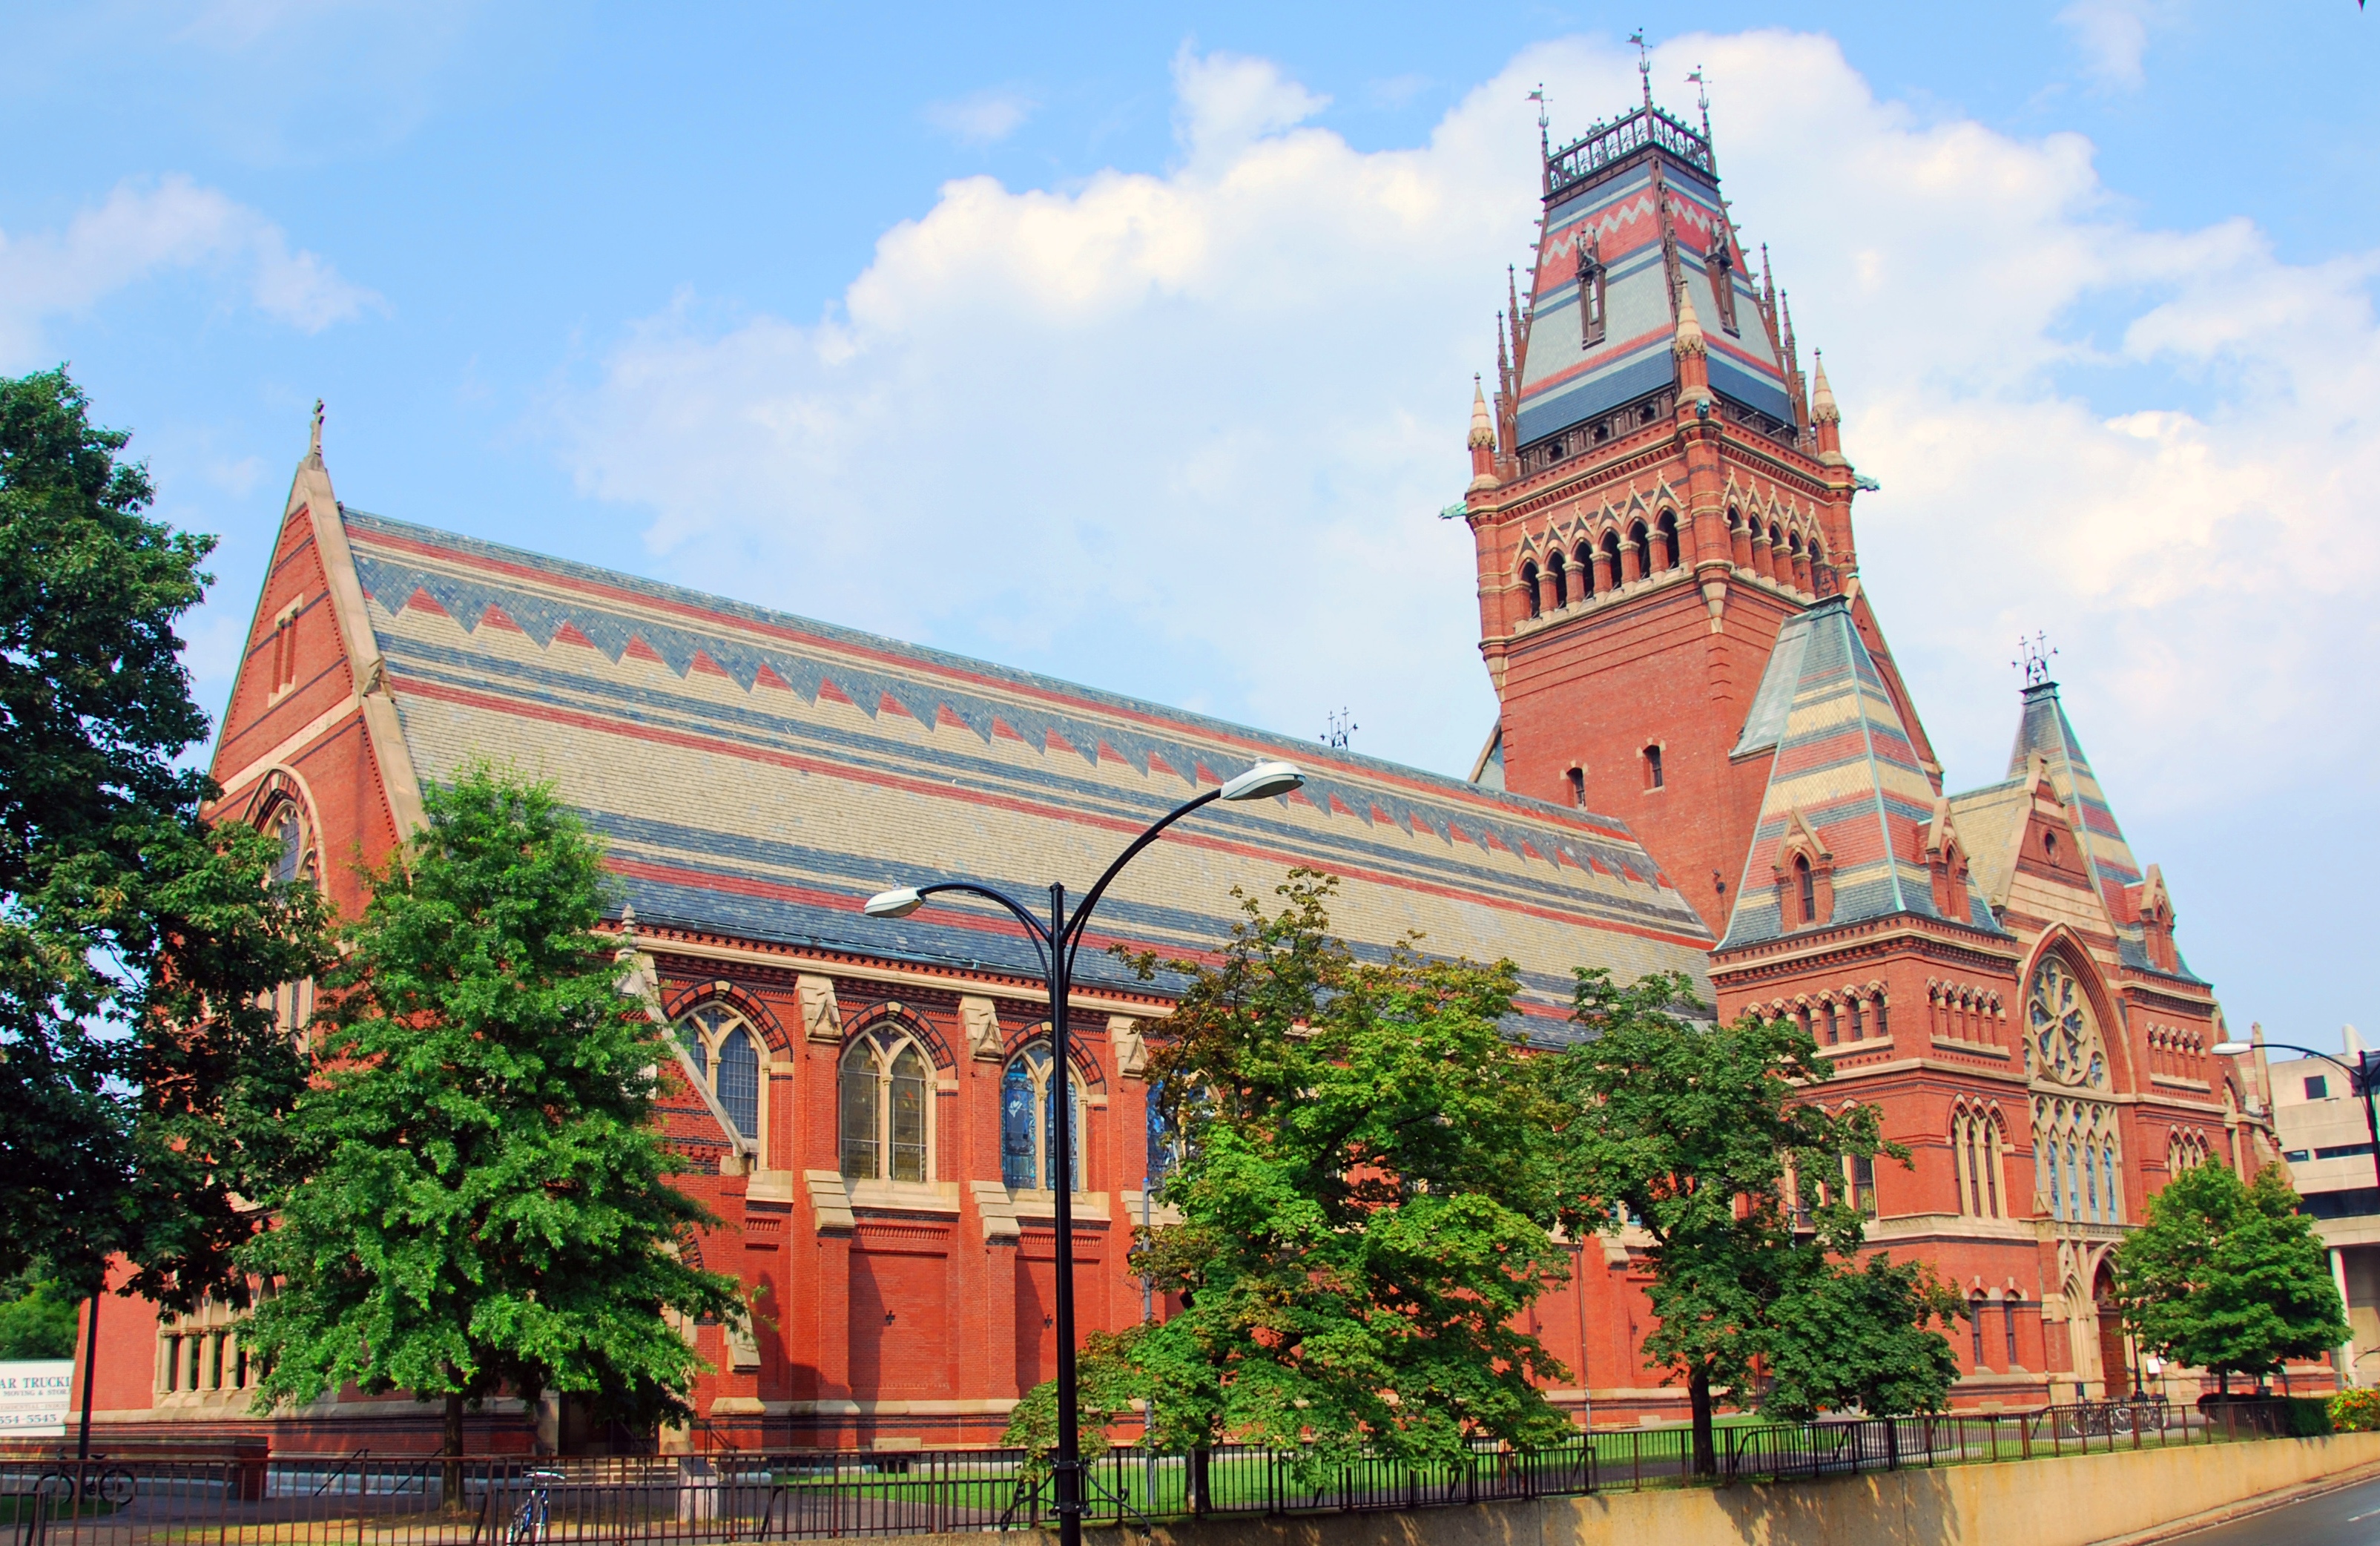
Harvard University
Cambridge, MA · Private · 7,110 undergraduates · founded 1636
—/ 10
Overall rating
No ratings yet
Admissions
Middle 50% is the range between the 25th and 75th percentile of enrolled students who submitted scores. Testing policies change; confirm the current policy with Harvard. Reading test scores →
Cost
Net price by family income
| Family income | Average net price |
|---|---|
| $0–30,000 | $8,697 |
| $30,001–48,000 | $2,991 |
| $48,001–75,000 | $2,091 |
| $75,001–110,000 | $9,941 |
| Over $110,000 | $53,337 |
Averages for students receiving federal aid. Use the net price calculator on Harvard’s website for an estimate for your family. Paying for college →
Outcomes
Students
Undergraduates by race and ethnicity
White31%
Asian22%
International15%
Hispanic or Latino12%
Black8.9%
Two or more races7.5%
Unknown3.5%
Largest majors
Departments →| Program | Graduates per year | Median earnings |
|---|---|---|
| Economics | 258 | $155,5924 years after graduating |
| Computer Science | 183 | $203,1694 years after graduating |
| Political Science and Government | 164 | $95,8384 years after graduating |
| History | 161 | $70,6794 years after graduating |
| Applied Mathematics | 120 | $170,6894 years after graduating |
| Research and Experimental Psychology | 101 | $70,1674 years after graduating |
| Neurobiology and Neurosciences | 100 | $46,9931 year after graduating |
| Chemistry | 76 | — |
| Cell/Cellular Biology and Anatomical Sciences | 75 | $117,8164 years after graduating |
| Mathematics | 61 | — |
Source: U.S. Department of Education, College Scorecard, most recent data as of October 2026. These figures are federal data, not student ratings.