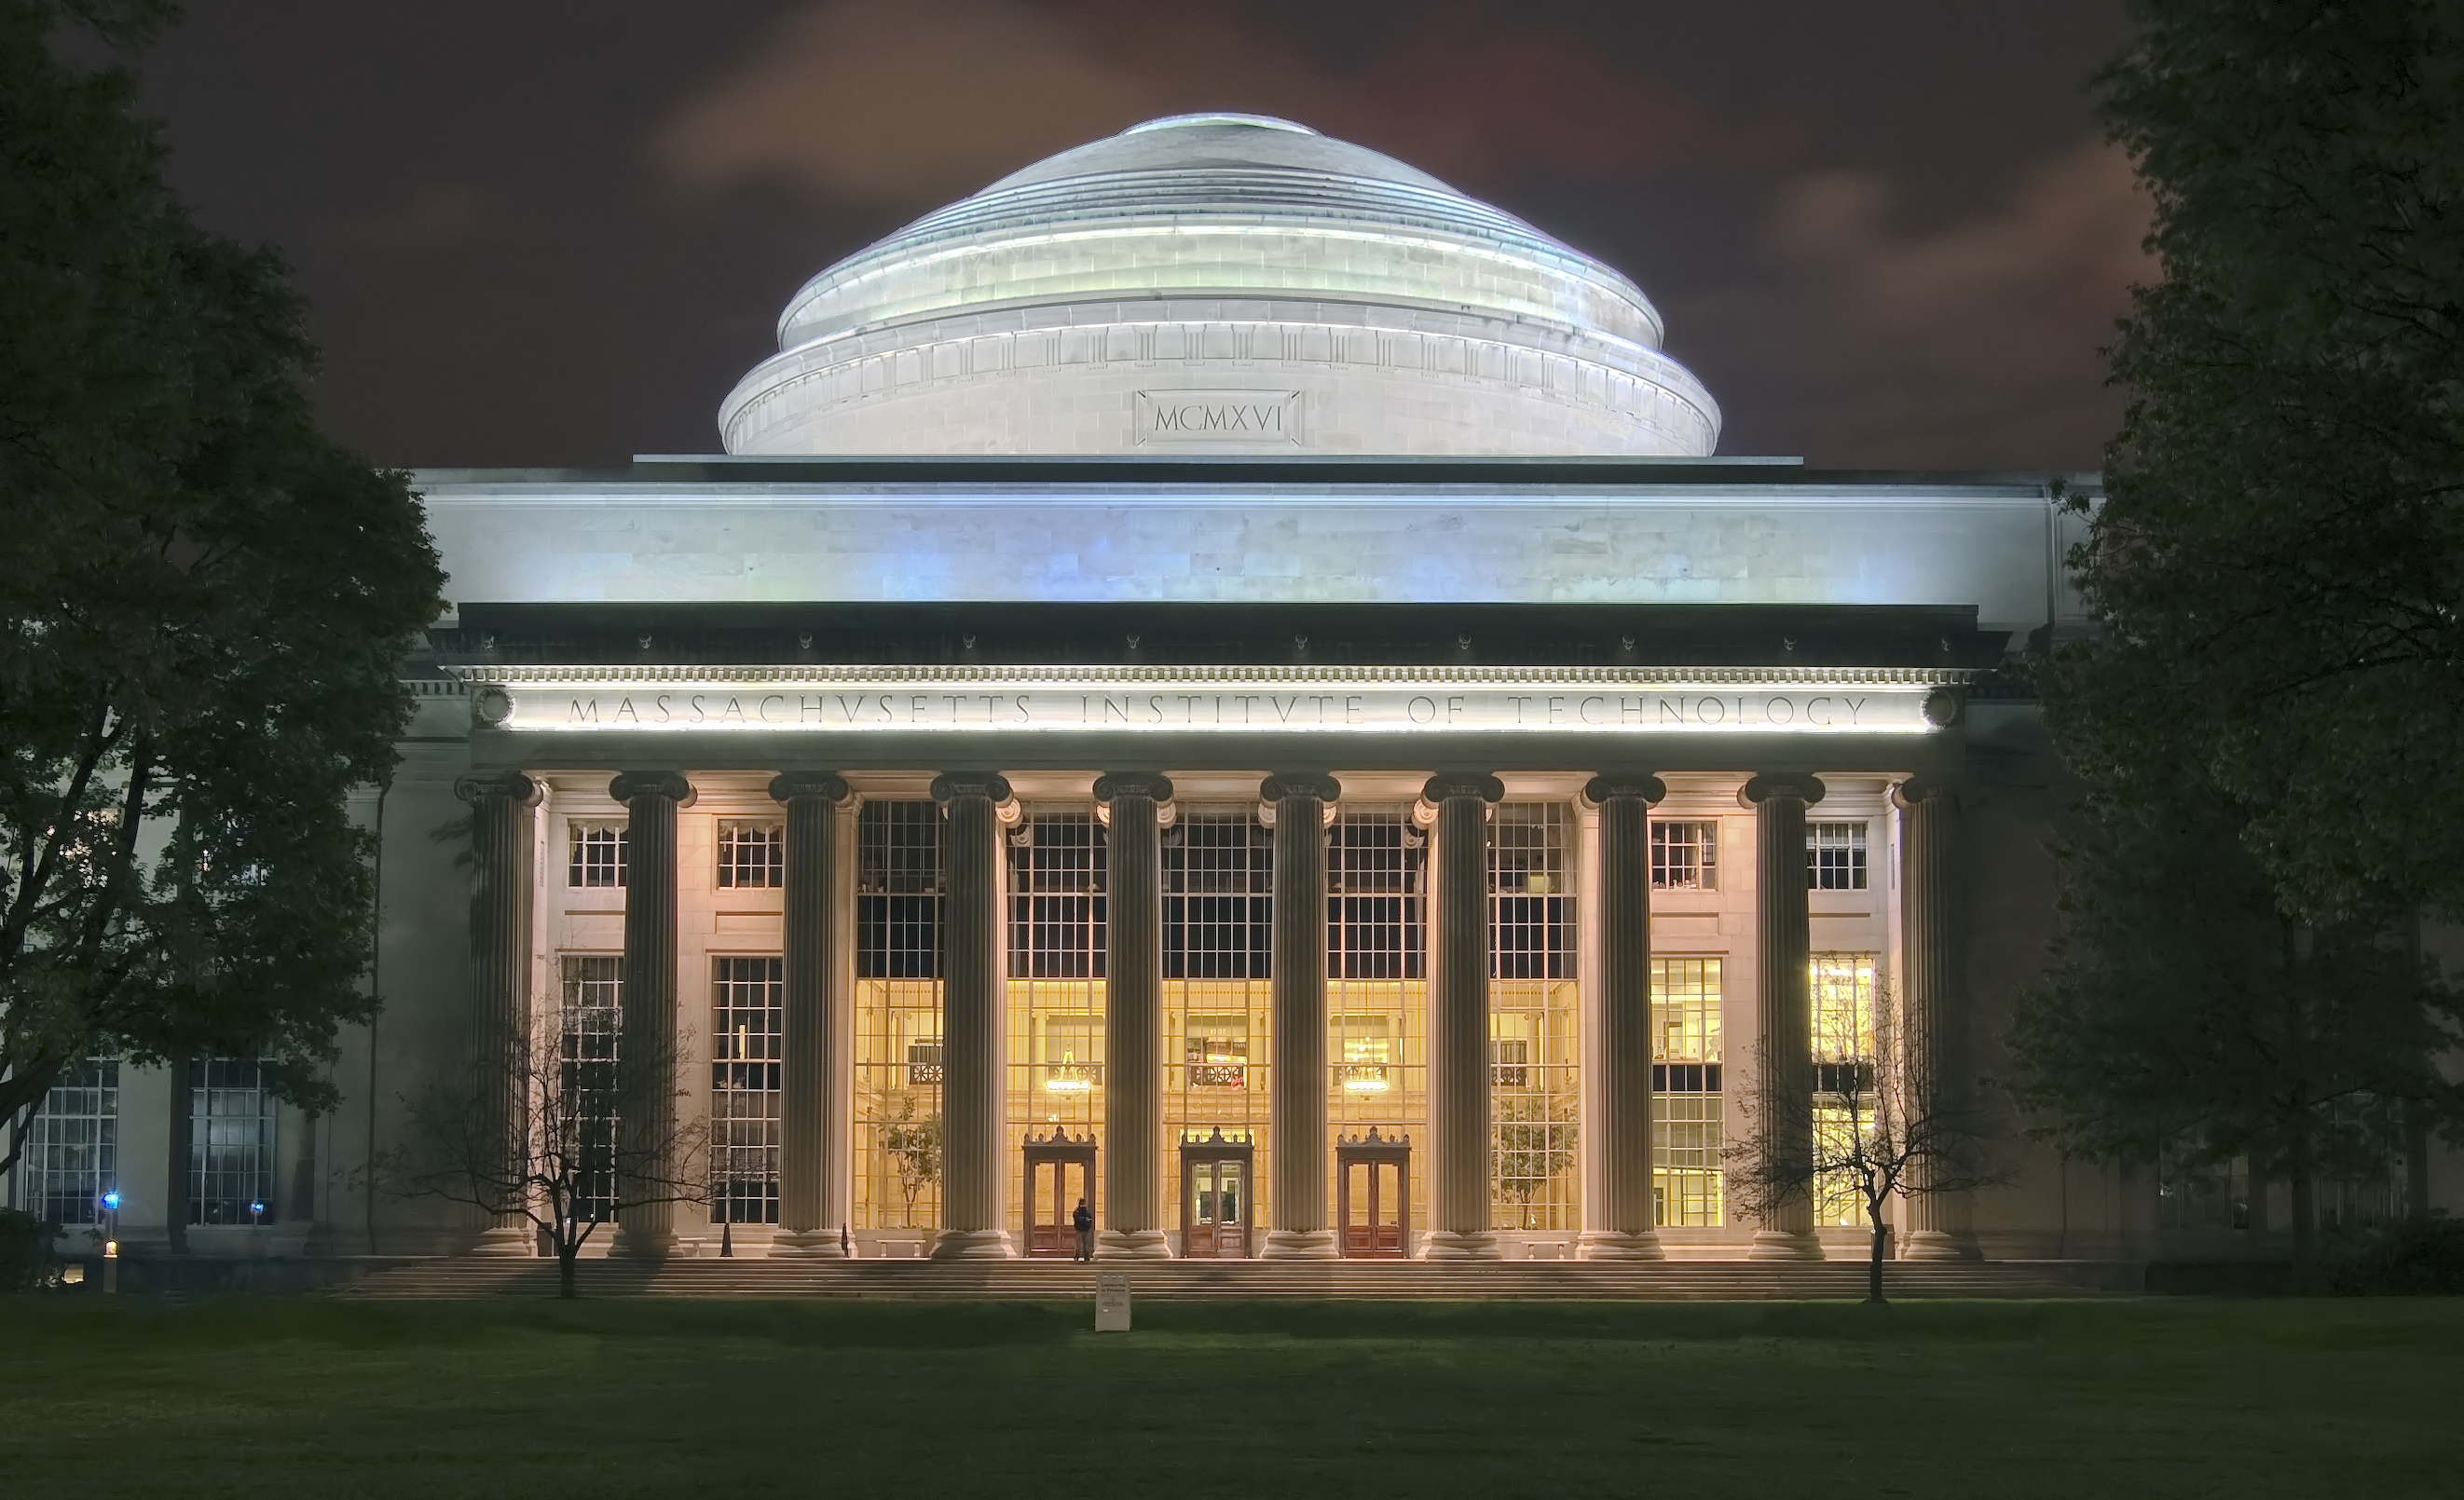
Massachusetts Institute of Technology
Cambridge, MA · Private · 4,600 undergraduates · founded 1861
Admissions
Middle 50% is the range between the 25th and 75th percentile of enrolled students who submitted scores. Testing policies change; confirm the current policy with MIT. Reading test scores →
Cost
Net price by family income
| Family income | Average net price |
|---|---|
| $0–30,000 | $-2,533 |
| $30,001–48,000 | $93 |
| $48,001–75,000 | $1,480 |
| $75,001–110,000 | $11,555 |
| Over $110,000 | $48,479 |
Averages for students receiving federal aid. Use the net price calculator on MIT’s website for an estimate for your family. Paying for college →
Outcomes
Students
Undergraduates by race and ethnicity
Asian35%
White21%
Hispanic or Latino14%
International12%
Black7.7%
Two or more races6.8%
Unknown3%
Largest majors
Departments →| Program | Graduates per year | Median earnings |
|---|---|---|
| Computer Science | 389 | $225,1414 years after graduating |
| Mechanical Engineering | 141 | $131,9674 years after graduating |
| Mathematics | 139 | $174,9514 years after graduating |
| Electrical, Electronics, and Communications Engineering | 87 | $161,1184 years after graduating |
| Physics | 79 | $131,0254 years after graduating |
| Cognitive Science | 61 | — |
| Aerospace, Aeronautical, and Astronautical/Space Engineering | 57 | $114,6204 years after graduating |
| Management Sciences and Quantitative Methods | 49 | $99,8431 year after graduating |
| Mathematics and Computer Science | 30 | $126,1531 year after graduating |
| Chemistry | 28 | — |
Source: U.S. Department of Education, College Scorecard, most recent data as of October 2026. These figures are federal data, not student ratings.